The Compliance dashboard
Today → Compliance is the firm's single live picture: how much AI work is happening, whether it's being classified, and where the governance stands. It's the page you'd open if a partner asked "so how are we doing on the AI compliance thing?"
The headline figures
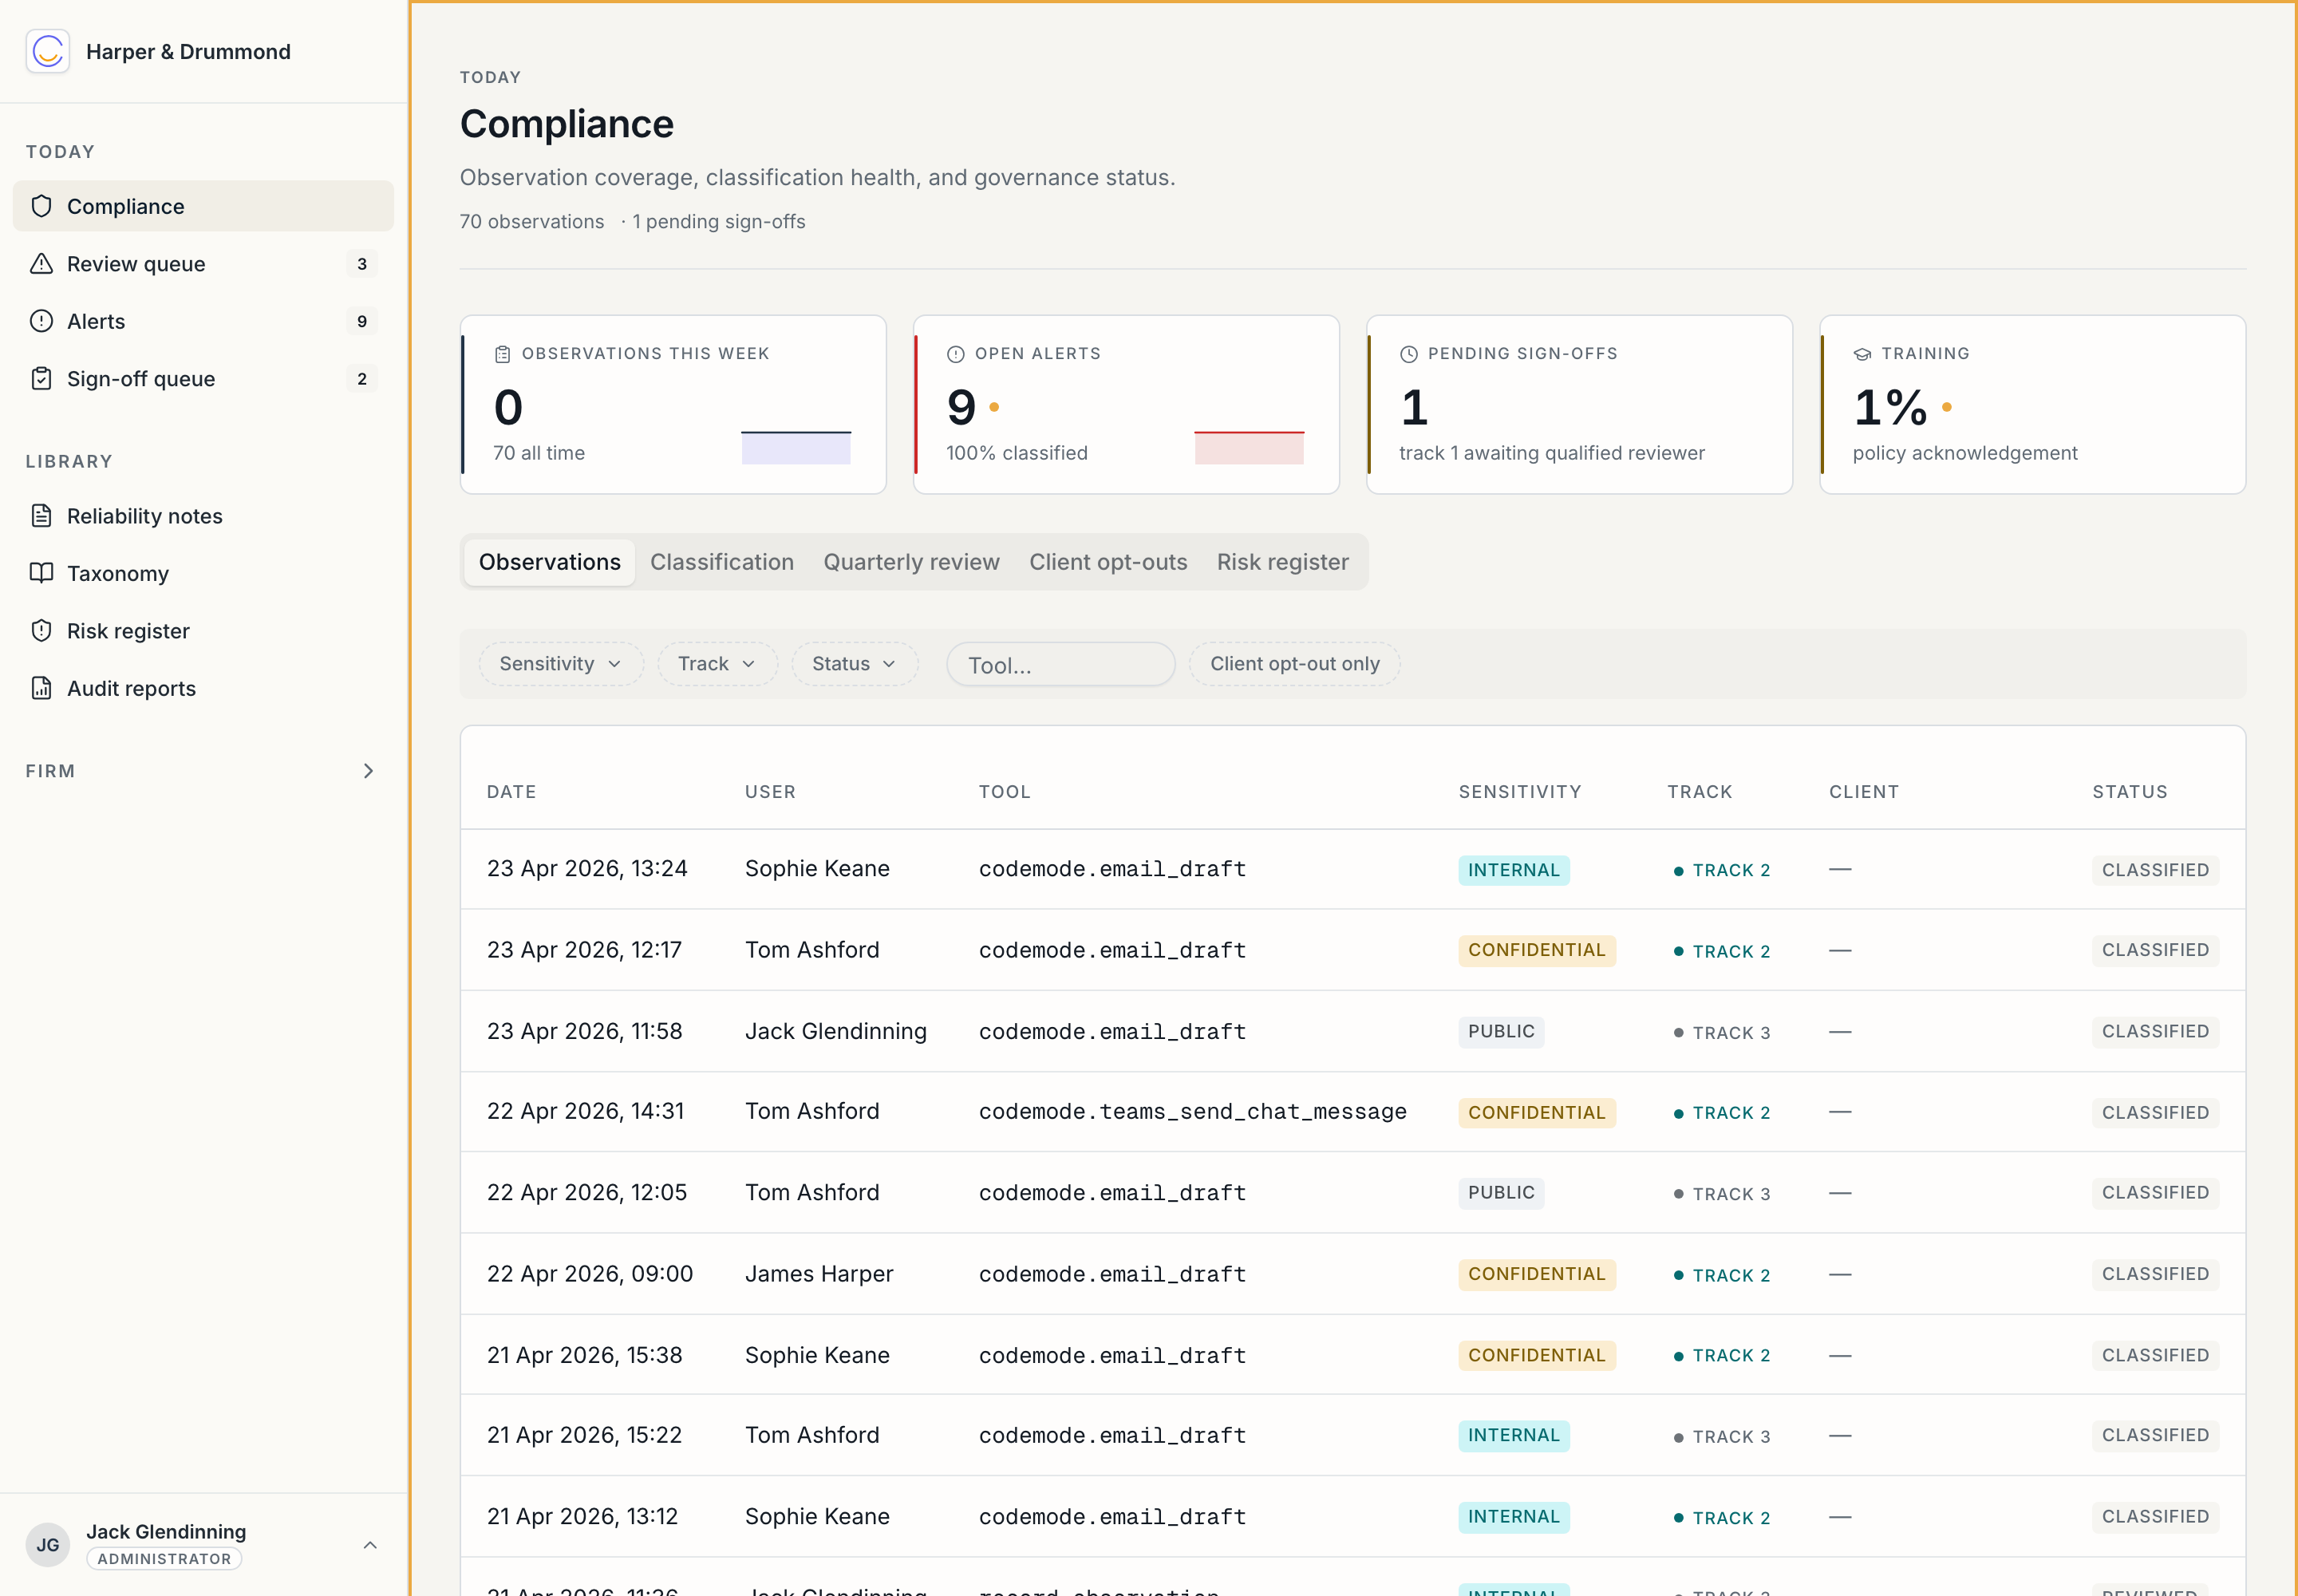
Four cards across the top:
- Observations this week — the volume of AI-assisted activity, with a fortnight trend and an all-time total. This is the firm's AI usage, quantified.
- Open alerts — exceptions currently needing a look. Usually a small number or zero. (Detail: Reviewing alerts.)
- Pending sign-offs — Track 1 items still in the legacy queue awaiting a qualified reviewer. Under the passive model this trends towards zero; see Review queue & overrides.
- Training — the proportion of the firm that has acknowledged the current AI policy. You want this at 100%; see Training records.
Above them, a one-line summary — total observations and how many are flagged — and the reassuring subtitle the whole product is built around: compliance, quietly.
The tabs
The dashboard is the parent page for several things that used to be separate menu entries:
- Observations — the live audit trail: every recorded AI action with its user, tool, matched use case, sensitivity, track, and classification status. Filter by sensitivity, track, status, tool, or "client opt-out only". This is what you'd show an auditor to answer "what AI work has this firm done?"
- Classification — the breakdown: how the firm's work splits across the three tracks and four sensitivity tiers, and across use cases. A quick read on whether the mix looks like your practice.
- Quarterly review — the quarter-level governance summary.
- Client opt-outs — the keyword-driven opt-out list. Covered in its own page: Client opt-outs.
- Risk register — a shortcut into the quarterly risk register; the AI Lead owns this — AI Lead → Risk register.
Classification overrides
Open any observation (click its row) and you can see its full classification and, if it's wrong, override it — change the track or sensitivity with a recorded reason. Overrides are themselves audited: the original classification, the new one, who changed it, and why are all kept. This is the human check on the automated classifier, and using it occasionally is healthy — it's also one of the signals the quarterly risk register draws on.
What to actually do here
For most admins, weekly:
- Glance at the four cards. Is volume roughly what you'd expect? Are open alerts low? Is training heading to 100%?
- If anything looks off, click into the relevant tab or the review queue.
That's the routine. The dashboard is a monitor, not an inbox.
Next: Review queue & overrides.